Technologies
1. Introduction
The ultimate ambition of the LITECS research programme is to reduce the environmental impact of aviation and industrial gas turbine engines, through development and deployment of new measurement technologies to enhance understanding and modelling of combustion and emissions generation processes and the role of alternative fuels.
The new technologies will revolutionise the measurement of gaseous and particulate combustion species and provide spatially and temporally resolved maps of strategic high priority species such as soot, CO2, CO, water and NO. The instrumentation systems developed by Strathclyde, Edinburgh and Manchester Universities will be installed on combustion research rigs at NCCAT (Loughborough) and LCCC (Sheffield) for experimental GTE research in this programme and far into the future. The instrumentation development programme focuses on tuneable diode laser spectroscopy (TDLS) as the basic measurement technique for gaseous species, laser induced incandescence (LII) for soot, multiple beam TDLS for tomographic species imaging and beam scanning for soot imaging. Southampton University is developing the new near-infra red (NIR) and mid-infrared (MIR) technology required for light amplification and delivery. An introduction to the various technologies targeted is provided below.
2. Tuneable Diode Laser Spectroscopy
2.1 Spectroscopy - basics


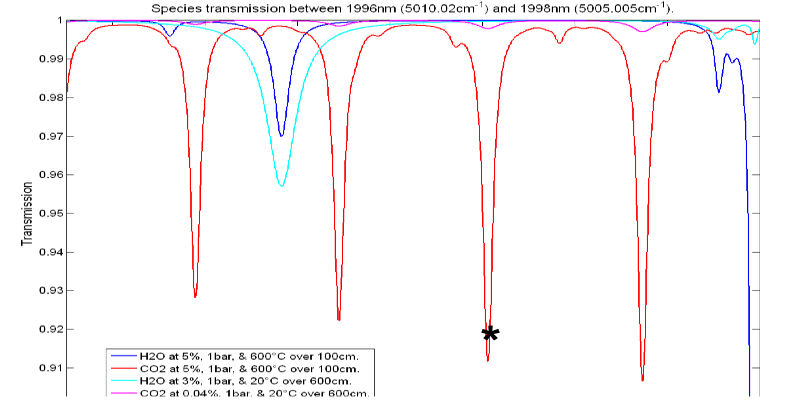
The vibrations of the molecular bonds can combine with molecular rotation at varying speeds / energies leading to many absorption lines associated with particular vibration-rotation combinations. The study of such absorption line is known as spectroscopy [1-3]. Figure 3 shows the rotation-vibration absorption spectra of CO2 and water at ambient temperature and 600°C at light wavelengths just less than 2000nm. Note that this can result in overlaps between line sets at specific frequencies and that we need to choose the lines we target for measurement to ensure no cross-species interference (Note that the CO2 line selected for measurement in Fig. 4 does not overlap with any water line).


If we can measure two lines with different temperature dependence, we can determine temperature from the ratio of the signal amplitudes (absorption strengths) – see Figure 6.

2.2 Tunable Diode Laser Spectroscopy (TDLS)

In TDLS [4], the laser is tuned repetitively over the line by applying a saw-tooth (repeating ramp) current to the diode laser (Fig. 7) and recording multiple measurements of the line-shape which can be averaged over many scans to clean up the signal to noise ratio (SNR). The laser output power increases with the increasing current in each ramp phase and the final line-shape is recovered by normalising, point by point, the recorded signal to the background intensity signal. The measurement process using line-shape models is as described above (Section 2.1). This is referred to as direct TDLS as the line-shape is recorded directly at the output of the photodiode [5-8]. However, this approach has significant disadvantages in terms of improving signal to noise ratio. Since the signal is recovered at low frequencies, at or near DC, it suffers from 1/f noise, laser intensity and phase noise and receiver noise (probably thermal). More significantly, for gas turbine engine measurements, any noise arising from beam propagation issues in a turbulent environment such as dynamic beam wander off and on the receiver, beam break-up or mechanical vibration are particularly destructive.
To beat the noise issues an advance on direct TDLS was developed referred to as wavelength modulation spectroscopy.
2.3 Tunable Diode Laser Spectroscopy (TDLS) with wavelength modulation spectroscopy (WMS)
In WMS the centre wavelength of the laser is repetitively scanned over the line using a saw-tooth current function, as before, but with a high frequency sinusoidal modulation (dither) current superimposed on it (Fig. 8, 9). As the laser centre wavelength traverses the line, the sinusoidal current dithers the laser wavelength (frequency). The interaction of the beam subjected to wavelength modulation (WM) with the absorption line-shape generates an intensity modulation (Fig. 9) at multiple harmonics of the fundamental modulation frequency [4, 9-16].


Transmitted signals at the modulation frequency are strongest and purest when the laser centre frequency is at a linear point of the line-shape and the higher harmonics are strongly generated when the centre frequency is passing over the highly non-linear regions. The intensity modulation harmonic signals arising from the wavelength dither are isolated in frequency and their amplitude measured by a lock-in amplifier (LIA – Fig. 8). The output of the LIA then traces of the amplitudes of the WM induced intensity modulated (WM-IM) signals. For the LIA set to record at the fundamental modulation frequency the output trace (1f signal) is a close approximation of the first derivative of the line-shape and, if set to record the second harmonic (the 2f signal), the output (2f signal) is a close approximation of the second derivative of the line-shape (Fig. 9) and so on.
In the WMS approach we can choose the modulation frequency and hence the frequency detected by the LIA to minimise the noise and maximise SNR. Figure 10 shows the measured noise spectrum on a recovered TDLS signal during a measurement on the exhaust of a gas turbine engine. If we make the measurement using a WMS approach to capture 1f or 2f signals above 400kHz we can, to a large extent, suppress the influence of all the noise sources. The information we want is recovered from a high frequency signal and thus we avoid the worst excesses of lower frequency 1/f noise, laser intensity noise and receiver noise, and suppress the noise arising from mechanical sources (turbulence in the beam path, vibrations etc.). Figure 11 shows a comparison of recovered signals from different approaches the black signal is from direct TDLS, the red is a 1f signal and the green signal is a 2f WMS signal from the LIA. This illustrates clearly the power of 2f WMS to recover signals with high SNR from extremely noisy photo-diode outputs and why it became the preferred choice for many applications.


2.4 Calibration free TDLS-WMS
Notwithstanding the above, 1f and 2f TDLS-WMS presents some difficulties. There is no intensity referencing and the signal amplitudes are strongly dependent on system parameters in a very complex way. As a result, it is mostly used with calibration of recovered signals to those from known gas mixtures. However, as system and component parameters tended to drift with time the integrity of stand-alone instruments was always questionable. In its simplest form, based on measurement of signal amplitude, they also suffer inaccuracies arising from varying pressure and temperature.
Since 2007 there have been many significant advances in TDLS-WMS to yield calibration free techniques that are very robust and ideally suited to stand-alone instruments in the field [14-16]. As well as the WM-IM signals carried by the beam onto the receiver, a direct IM signal is present from the intensity modulation of the laser by the high frequency sinusoidal drive current (known more widely as the residual amplitude modulation or RAM signal). The result is phase related distortion of the recovered IM and WM-IM signals at 1f or 2f with accompanying in accuracies. Due to the nature of the laser modulation, the WM-IM signals are phase delayed relative to the direct modulation IM signals. Recognising this led to techniques to isolate the direct IM and WM-IM signals by phase selection or a phasor decomposition approach [14, 16]. These led to calibration free approaches based on the phase isolated direct IM signals, which enabled direct recovery of the absorption line-shape [14, 16]. Extraction of gas concentration and pressure (T known) then followed the same measurement procedure as for direct TDLS. The techniques required accurate, in-situ, characterisation of the system parameters [17] and refinements of the models particularly for high temperature use [18].
A particularly useful calibration free approach [15] that provides intensity referencing normalises the WM-IM 2f signal to the 1f signal (takes the point to point ratio of the 2f to 1f signals). The two signals contain the same common-mode optical noise components, including from the laser and the beam path generated noise from turbulence and vibration. Hence, the normalisation process largely eliminates such noise from the processed signals vastly improving the SNR. The resulting signals, though, are strongly dependent on system parameters particularly the laser modulation characteristics, such as relative IM to WM-IM phase and the laser wavelength tuning coefficient. This approach is made more accurate by the new understanding of phase related IM distortion and laser tuning, how to characterise them in-situ on stand-alone instruments and take account of them in the signal analysis [14, 16-22]. Even with such complex and careful signal generation, recovery and processing techniques, the recovered signals are uniquely related to C, P and T. Hence, with accurate models of the 2f/1f signals, accounting for system parameters and the variations of key spectral parameters, we can again simply fit the models to the measured signals by varying C and P / T in the model (with T or P known). This approach was used in a study of CO2 in the exhaust plume of a GTE [23]. Measured 2f/1f signals for CO2 in that study for two different thrust levels are shown in Figures 12a and 12b along with the theoretical simulations of these signals for those concentrations


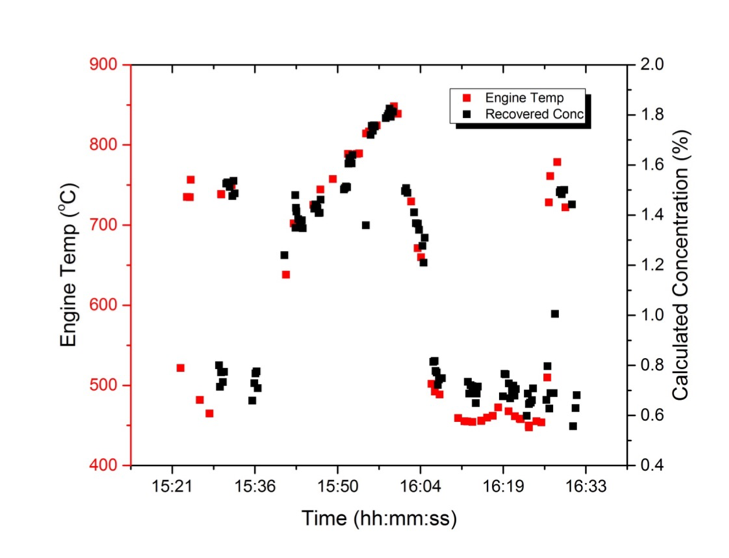
The excellent SNR confirms the efficacy of the normalisation in eliminating the common-mode noise. The technique was used to investigate CO2 concentration in the exhaust plume of a GTE as the thrust was cycled. The results are presented in Figure 13 along with the engine temperature measured by a thermocouple. The strong correlation in trends is evident as the engine thrust is cycled, again indicating the efficacy of the approach.
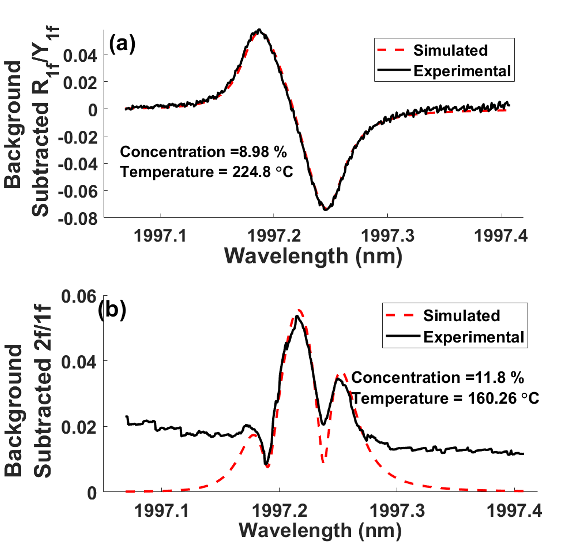
A further calibration free technique with intensity referencing and noise cancellation [24] was developed by the Strathclyde team in 2018. This technique normalised the 1f WM-IM signal to the 1f isolated pure IM (RAM) signal, recorded in quadrature, giving excellent results for SNR and CO2 measurement integrity [24] in measurements made on a GTE combustor at Cardiff University. A sample measured signal compared with a simulated signal fitted to it is shown in Figure 14a. For comparison the 2f/1f signal derived from the same measurement is shown in Figure 14b. This RAM normalised 1f-WMS approach [24] and the 2f/1f normalisation approach [15] will be used in LITECS.
References
- J. Michael Hollas, Modern Spectroscopy, 4th ed., Chichester, England, John Wiley & Sons Ltd, 2004.
- C. N. Banwell and E. M. McCash, Fundamentals of Molecular Spectroscopy, 4th ed., New York, McGraw-Hill, 1995.
- G. M. Barrow, Introduction to Molecular Spectroscopy, London, McGraw-Hill,1962.
- George Stewart, Laser and Fiber Optic Gas Absorption Spectroscopy, Cambridge University Press, to be published February 2021, ISBN 9781107174092.
- E. D. Hinkley, “High-resolution infrared spectroscopy with a tunable diode laser,” Appl. Phys. Lett., vol. 16, no. 9, pp. 351–354, May 1970.
- J. Reid, J. Shewchun, B. K. Garside, and E. A. Ballik, “High sensitivity pollution detection employing tunable diode lasers,” Appl. Opt., vol. 17, no. 2, pp. 300–307, Jan. 1978.
- J. Reid, B. K. Garside, J. Shewchun, M. El-Sherbiny, and E. A. Ballik, “High sensitivity point monitoring of atmospheric gases employing tunable diode lasers,” Appl. Opt., vol. 17, no. 11, pp. 1806–1810, Jun. 1978.
- D. T. Cassidy and J. Reid, “Atmospheric pressure monitoring of trace gases using tunable diode lasers,” Appl. Opt., vol. 21, no. 7, pp. 1185–1190, Apr. 1982
- D. S. Bomse, A. C. Stanton, and J. A. Silver, “Frequency modulation and wavelength modulation spectroscopies: Comparison of experimental methods using a lead—Salt diode laser,” Appl. Opt., vol. 31, no. 6, pp. 718–731, Feb. 1992.
- J. Reid and D. Labrie, “Second-harmonic detection with tunable diode lasers—Comparison of experiment and theory,” Appl. Phys. B, Lasers Opt., vol. 26, no. 3, pp. 203–210, Nov. 1981.
- J. M. Supplee, A. Whittaker, and W. Lenth, “Theoretical description of frequency modulation and wavelength modulation spectroscopy,” Appl. Opt., vol. 33, no. 27, pp. 6294–6302, Sep. 1994.
- L. C. Philippe and R. K. Hanson, “Laser diode wavelength-modulation spectroscopy for simultaneous measurement of temperature, pressure and velocity in shock-heated oxygen flows,” Appl. Opt., vol. 32, no. 30, pp. 6090–6103, Oct. 1993
- S. Schilt, L. Thevenaz, and P. Robert, “Wavelength modulation spectroscopy: Combined frequency and intensity laser modulation,” Appl. Opt., vol. 42, no. 33, pp. 6728–6738, Nov. 2003.
- K Duffin, A J McGettrick , W JOHNSTONE., G Stewart and D Moodie, “Tunable diode laser spectroscopy with wavelength modulation: a calibration free approach to the recovery of absolute gas absorption line shapes” IEEE Journal of Lightwave Technology, vol. 25, no. 10, pp3114-3125, DOI: 10.1109/JLT.2007.904937, October 2007.
- G. B. Rieker, J. B. Jeffries, and R. K. Hanson, “Calibration-free wavelength-modulation spectroscopy for measurements of gas temperature and concentration in harsh environments,” Appl. Opt., vol. 48, no. 29, pp. 5546–5560, 2007.
- A J McGettrick, Duffin K., W Johnstone, G Stewart and D Moodie, “Tunable diode laser spectroscopy with wavelength modulation: a phasor decomposition method for calibration free measurements of gas concentration and pressure” IEEE Journal of Lightwave Technology, vol. 26, no. 4, pp432-440, DOI: 10.1109/JLT.2007.912519, February 2008.
- W Johnstone, A J McGettrick, K Duffin, A Cheung and G Stewart, “Tunable diode laser spectroscopy for industrial process applications: system characterization in conventional and new approaches”, IEEE Sensors Journal, Vol. 8, No. 7, 1079-88, DOI: 10.1109/JSEN.2008.926168, July 2008.
- A. J. McGettrick, W. Johnstone, R. Cunningham and J. Black, “Tunable diode laser spectroscopy: calibration free measurements of gas composition at elevated temperature and pressure”, IEEE Journal of Lightwave Technology, 27, 15, pp3150-3161, August 2009, 10.1109/JLT.2008.2008729.
- K. Ruxton, A.L. Chakraborty, W. Johnstone, M. Lengden, G. Stewart, K. Duffin, "Tunable Diode Laser Spectroscopy with Wavelength Modulation: Elimination of Residual Amplitude Modulation in a Phasor Decomposition Approach", Sensors and Actuators B, Vol. 150, No.1, pp367-375, September 2010. DOI: 10.1016/j.snb.2010.06.058.
- G Stewart, W Johnstone, J Bain, K Ruxton and K Duffin, “Recovery of absolute gas absorption line shapes using tuneable diode laser spectroscopy with wavelength modulation – Part 1: theoretical analysis” IEEE Journal of Lightwave Technology, 29, 6, pp811-821, 2011, DOI: 10.1109/JLT.2011.2107312.
- J Bain, W Johnstone, K Ruxton, G Stewart, M Lengden and K Duffin, “Recovery of absolute gas absorption line shapes using tuneable diode laser spectroscopy with wavelength modulation – Part 2: Experimental Investigation” IEEE Journal of Lightwave Technology, 29, 7, pp987-996, 2011, DOI: 10.1109/JLT.2011.2107729.
- Benoy, Thomas; Lengden, Michael; Stewart, George; Johnstone, Walter. Recovery of absorption line shapes with correction for the wavelength modulation characteristics of DFB lasers”. IEEE Photonics Journal. 2016 ; Vol. 8, No. 3. DOI: 10.1109/JPHOT.2016.2558504.
- Benoy, T., Wilson, D., Lengden, M., Armstrong, I., Stewart, G., & Johnstone, W. Measurement of CO2 cncentration and temperature in an aero engine exhaust plume using wavelength modulation spectroscopy, IEEE Sensors Journal 2017, 17, 19, p 6409-6417. DOI: 10.1109/JSEN.2017.2738333.
- Upadhyay, Abhishek ; Lengden, Michael ; Wilson, David ; Humphries, Gordon Samuel ; Crayford, Andrew P. ; Pugh, Daniel G. ; Johnson, Mark P. ; Stewart, George ; Johnstone, Walter. “A new RAM normalized 1f-WMS technique for the measurement of gas parameters in harsh environments and a comparison with 2f/1f”, EEE Photonics Journal. 2018 ; Vol. 10, No. 6. DOI: 10.1109/JPHOT.2018.2883548.
3. Chemical Species Tomograpy (CST)
[Section to be supplied]
4. Laser Induced Incandescence (LII)
[Section to be supplied]
EPSRC Programme: Laser Imaging of Turbine Engine Combustion Species
Contact: Professor Walter Johnstone
LITECS is funded by
Site design by Aggelia